Analyze your gateway, end-device and application health with Network Operations Center
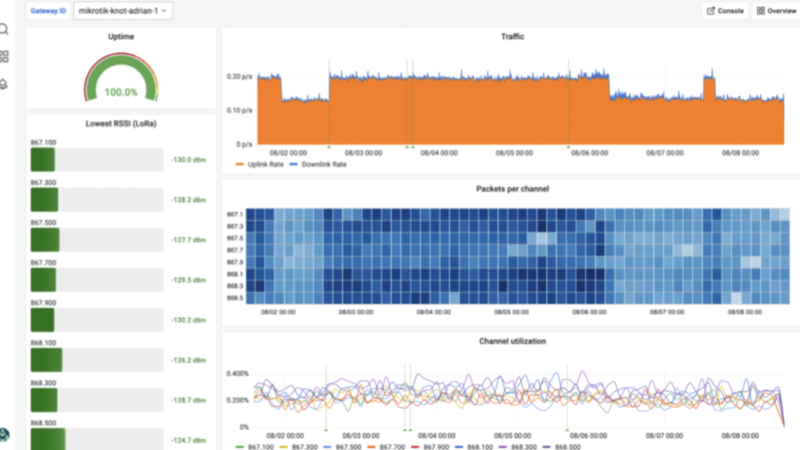
Network Operations Center (NOC) is The Things Stack offering that enables LoRaWAN network-related, device and application analytics on historical data.
NOC simplifies the access to processed and aggregated historical data, which normally is hard to reach while looking at individual event streams. This helps to make more informed conclusions about the state of individual end devices and gateways.
Gateway statistics
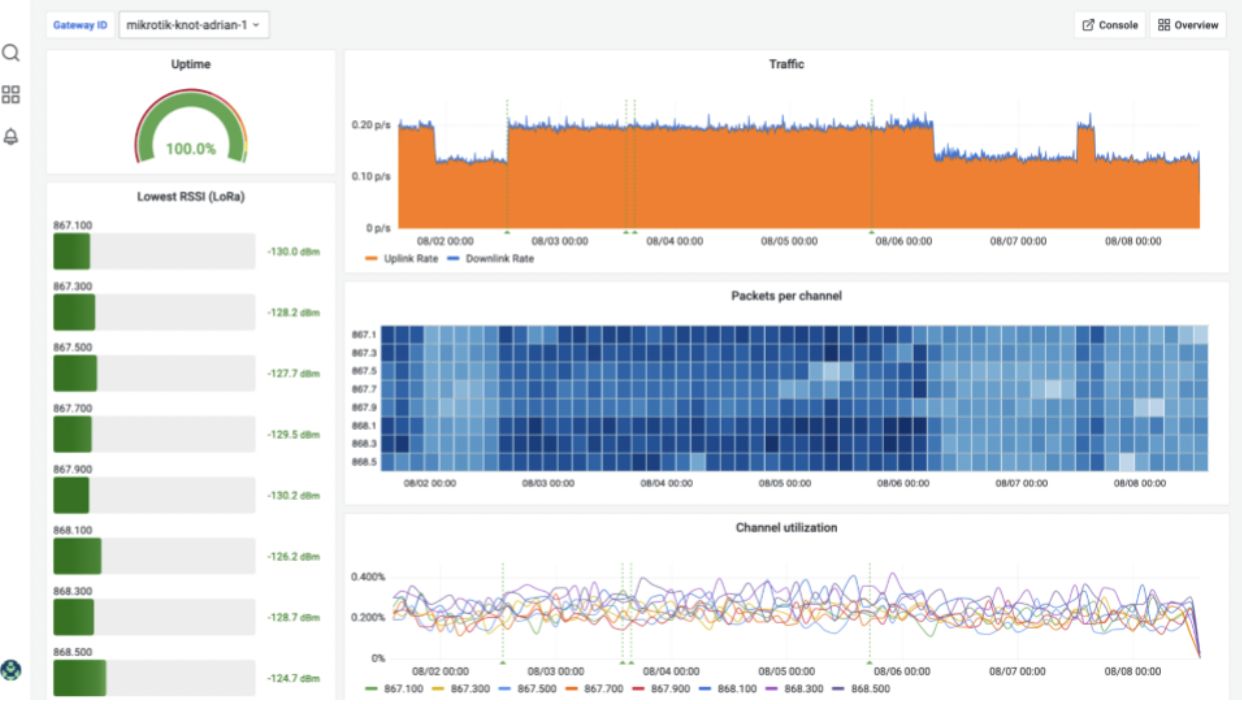
The Things Stack Cloud users have access to the gateway statistics through the NOC. The overview page provides a high-level overview of the network, with a focus on gateways:
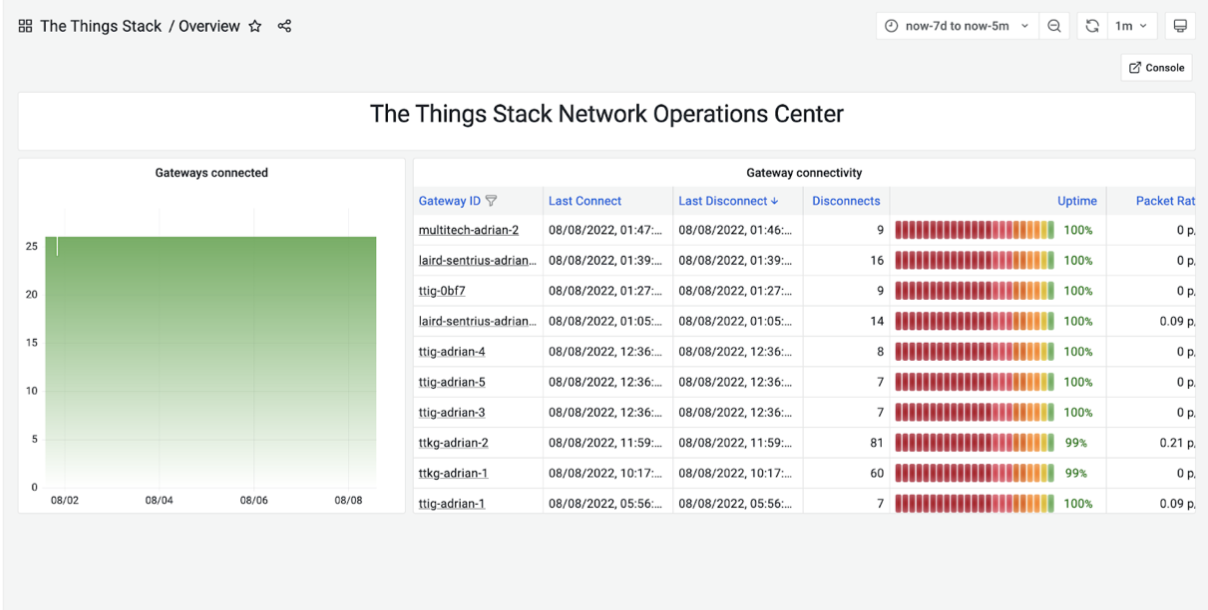
It visualizes the information about the gateway connectivity (which may reveal a flaky network connection or overall gateway behavior, traffic, uptime (the fraction of time in which the gateway has been connected to the Network Server), packets per channel, and the last recorded packet rate (uplink + downlink):
Capabilities:
- Examine statistics of an individual gateway through gateway details
- See how traffic patterns evolve over time through the traffic graphic
- Monitor connection and disconnection events
- See which channels are overused and may be prone to collisions through the packets per channel histogram and channel utilization graph
- Asses the range of the gateway through the lowest RSSI bargauge chart
End-device and application statistics
On top of gateway statistics, The Things Stack Cloud Plus users can access the following application and device analytics:
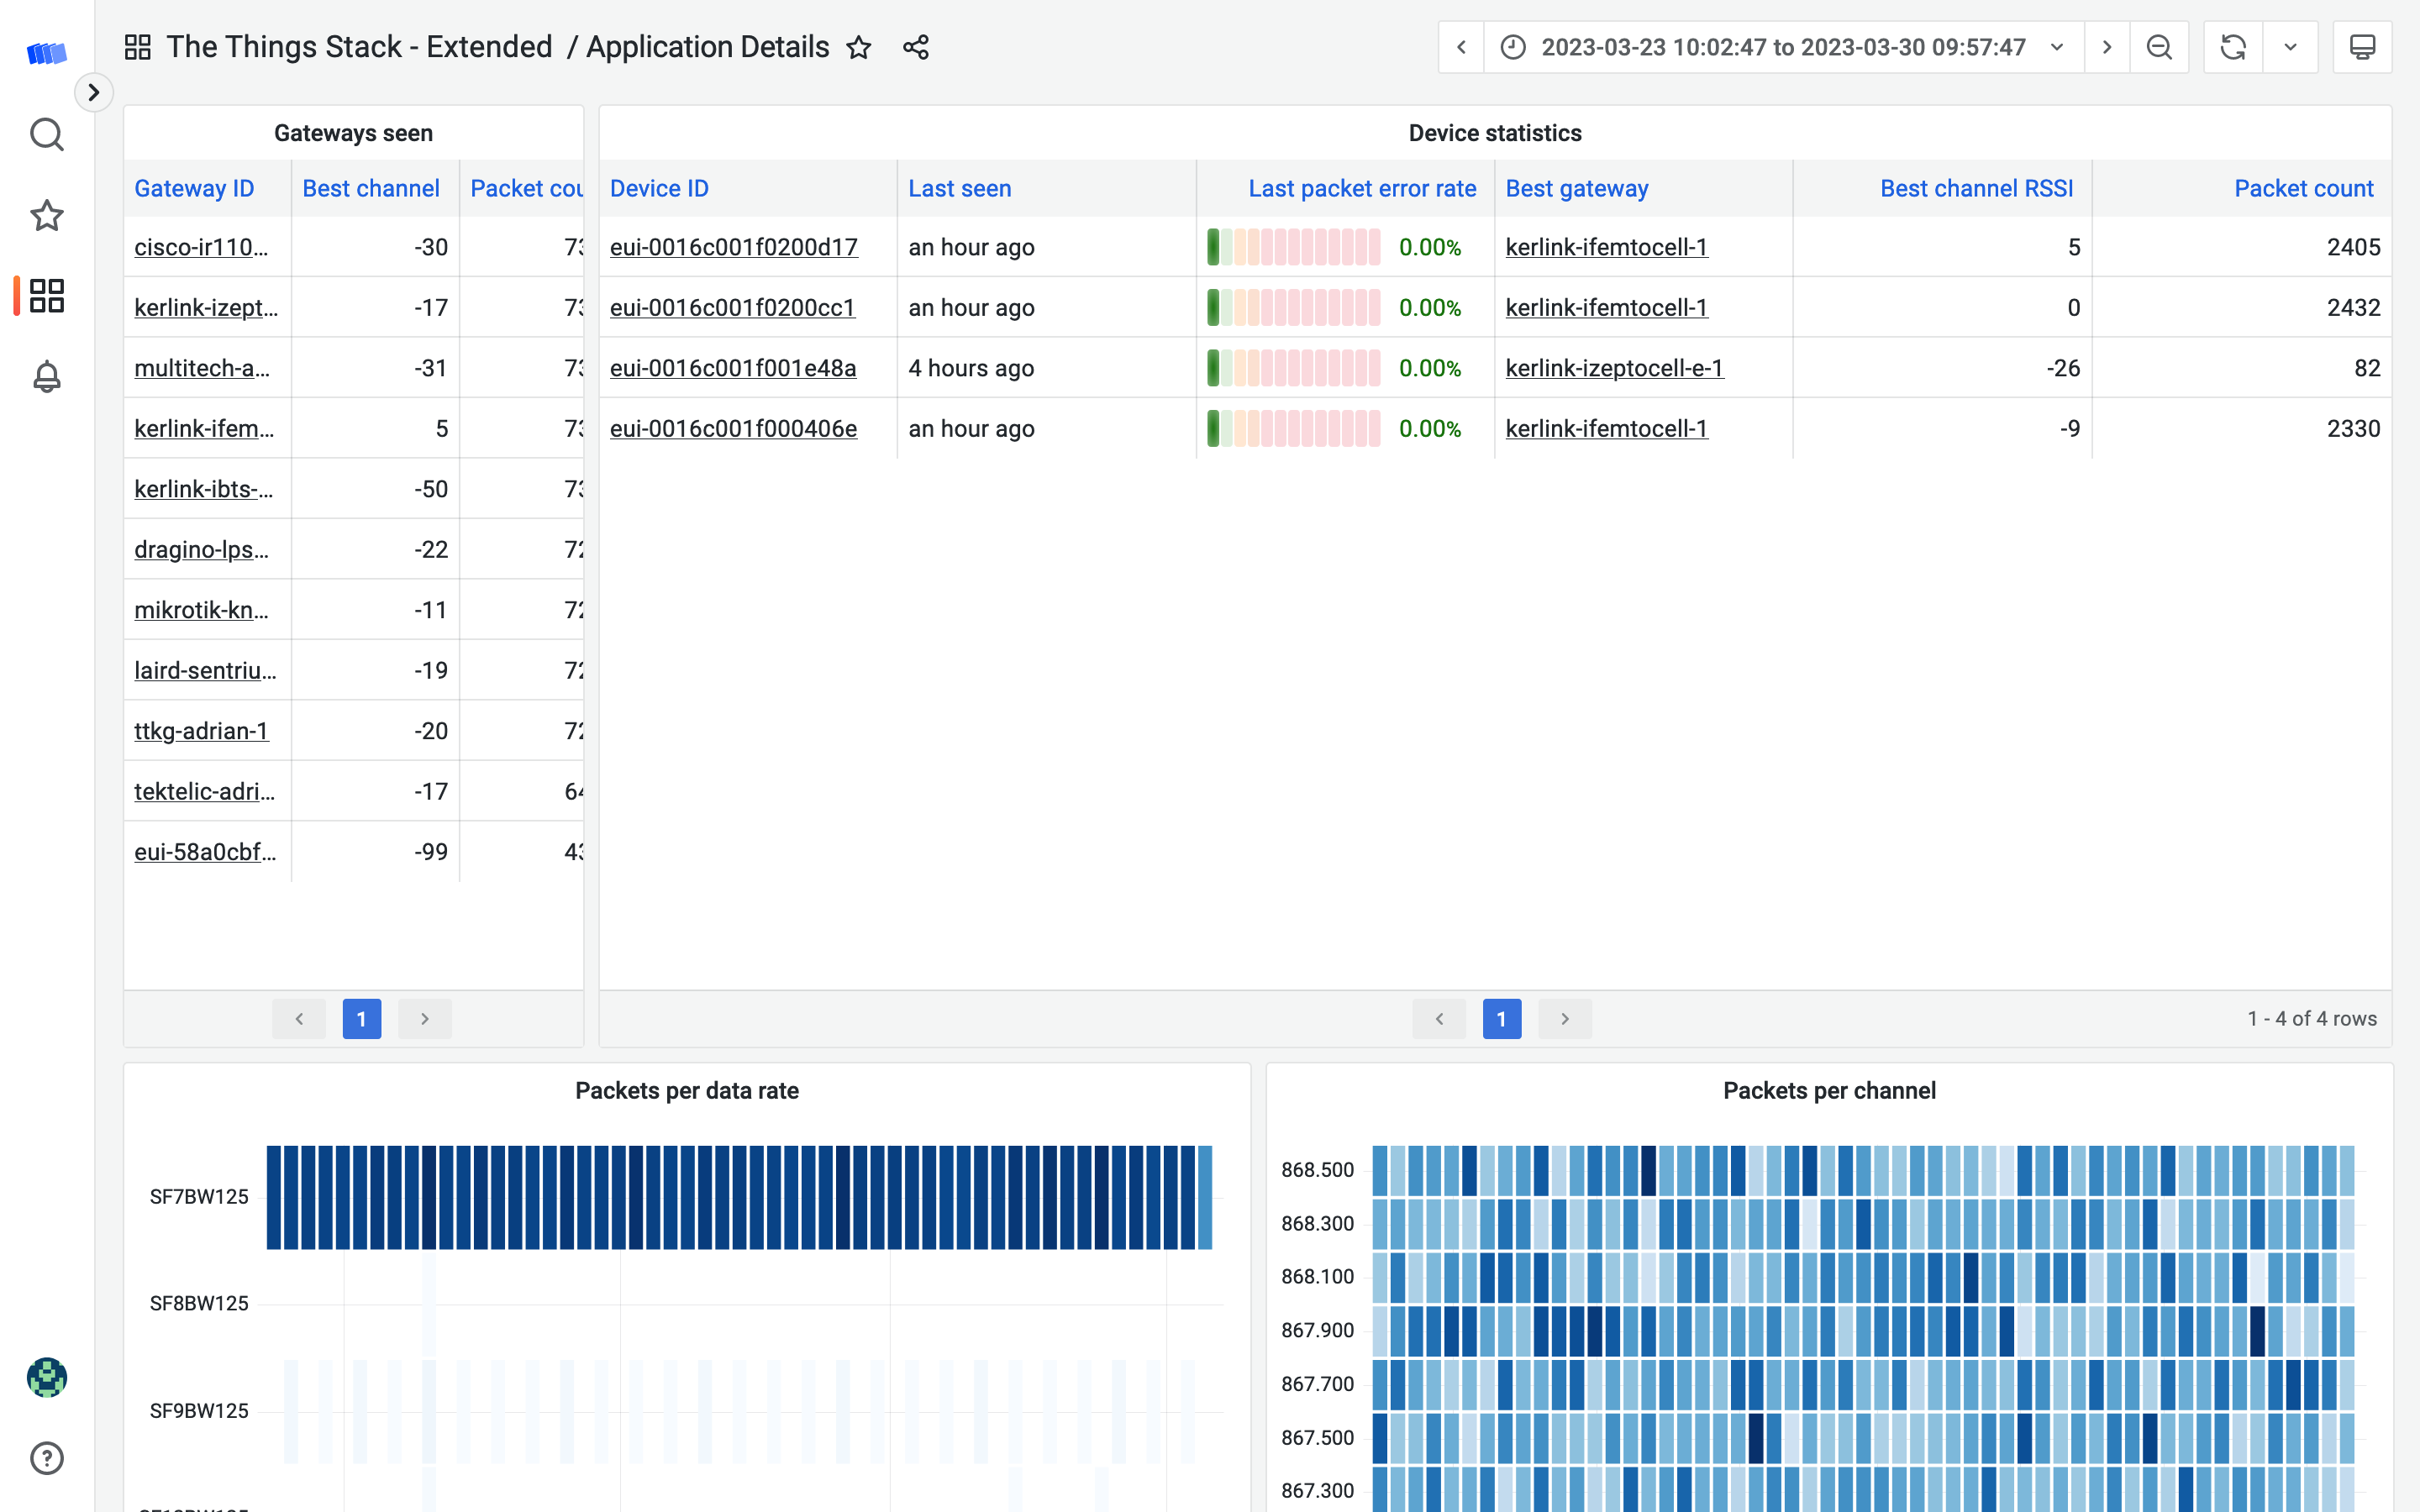
- Application-level details and overviews to assess the health of end devices
- Assess the battery usage and lifetime of the end device through data rate changes and packet loss rates
- Assess end devices that are vulnerable to packet loss do lack of redundancy (i.e. are covered by a single gateway) through an overview of gateways that cover an individual application
Capabilities:
- Examine statistics of an individual application through application details
- See which channels are overused and may be prone to collisions through the packets per channel histogram
- See the data rate evolution in order to asses battery usage through the packets per data rate histogram
- Asses gateway coverage and redundancy through the gateways seen in the table
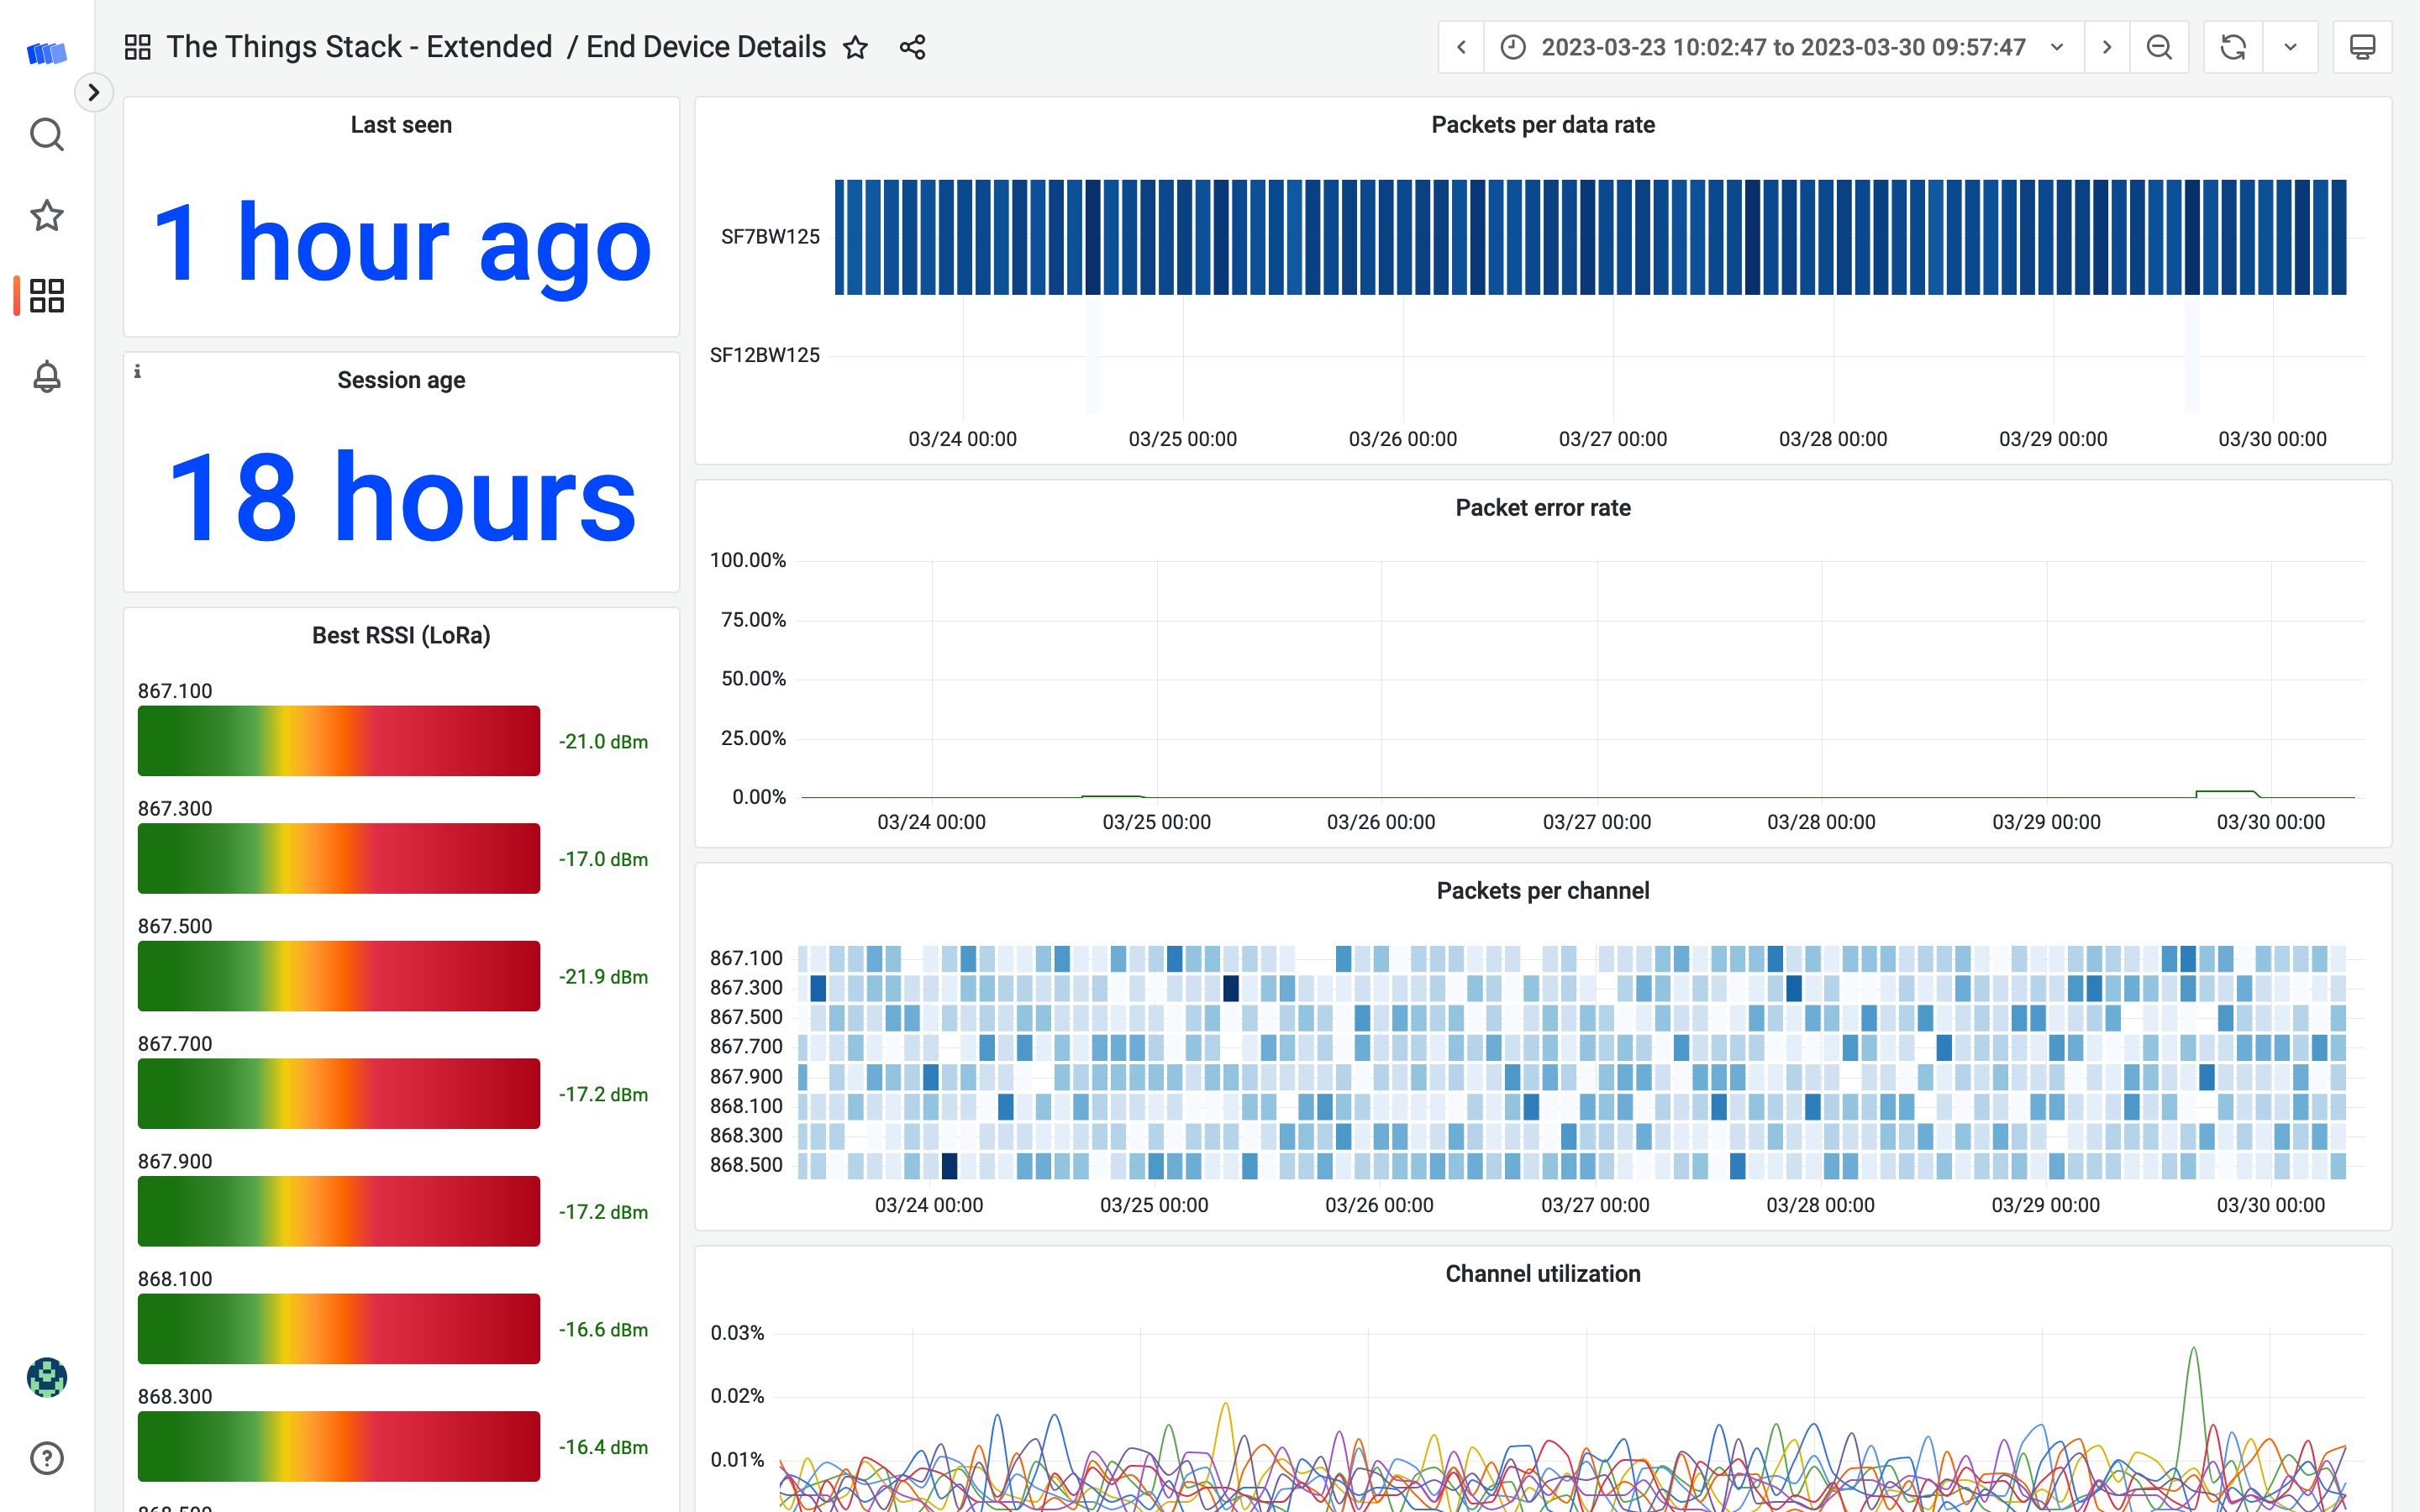
- Examine statistics of an individual gateway through end device details
- See how traffic patterns evolve over time through the traffic graphic
- See which channels are overused and may be prone to collisions through the packets per channel histogram and channel utilization graph
- See the data rate evolution in order to asses battery usage through the packets per data rate histogram
- Monitor packet loss through the packet error rate graph
- Assess the range of the end device through the lowest RSSI bargauge chart
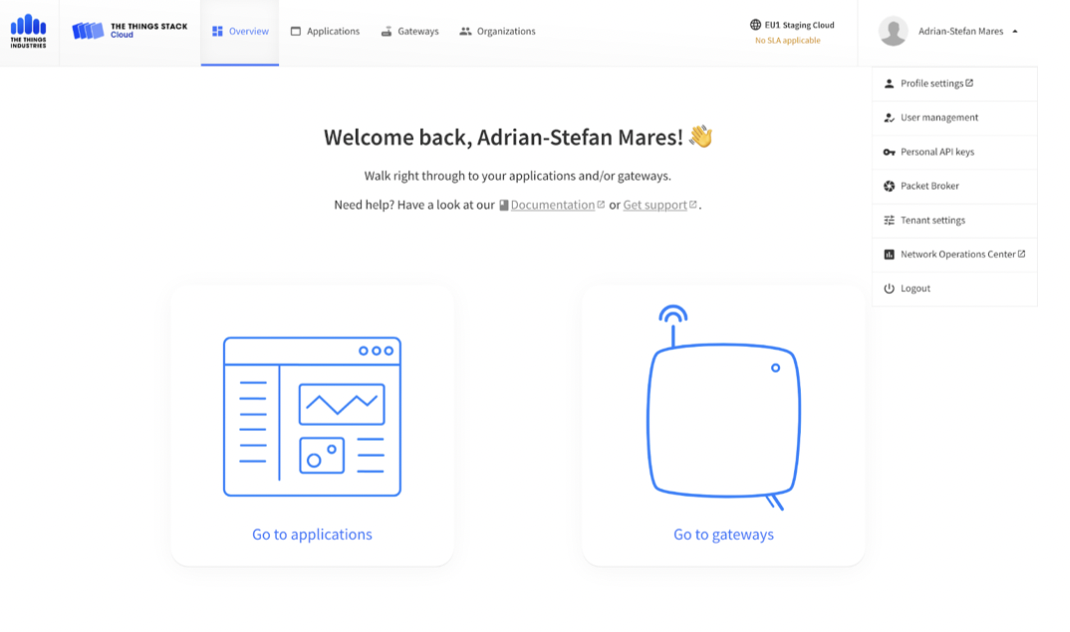
Access The Things Stack Network Operations Center via your deployment domain:
Start bringing value to your projects and customers with The Things Stack. Check out deployment options
Try out The Things Stack features like NOC before subscribing fully. Discover The Things Stack
